What Are the Key Logistics Industry Benchmarks for 2025
You need to focus on logistics industry benchmarks to keep your business competitive in 2025. The most important KPIs include inventory turnover rate, inventory accuracy, days of inventory on hand, freight cost per unit, on-time delivery rate, order accuracy, and warehouse capacity usage. Check the latest values:
Metric | Value |
|---|---|
78.4 | |
Warehouse Capacity | 50.0 |
Future Inventory Cost Growth | 78.9 |
Future Warehouse Capacity | 53.9 |
Tracking these KPIs helps you spot performance gaps and improve your service. Data-driven management and industry standards guide you to refine strategies and boost efficiency.
Key Takeaways
Focus on key logistics KPIs like inventory turnover and on-time delivery to measure your supply chain's health.
Regularly track industry benchmarks to identify performance gaps and set improvement goals for your logistics operations.
Use data-driven strategies to enhance efficiency, reduce costs, and improve customer satisfaction in your logistics processes.
Review your KPIs frequently, ideally weekly, to catch issues early and keep your operations running smoothly.
Aim for high accuracy in inventory and order fulfillment to minimize returns and boost customer loyalty.
Defining Logistics KPIs
What Are Logistics KPIs
You need to understand logistics KPIs to measure how well your supply chain works. These key performance indicators help you track important activities like order management, inventory, and transportation. You can see how each stage of your logistics process performs by using the right KPIs. Here is a table that shows how KPIs fit into different areas:
Stage | Focus Areas |
|---|---|
Order Management | |
Supply | Lead time, capacity utilization |
Inventory | Stock levels, turnover rates |
Distribution | Delivery times, cost per delivery |
Transport Management | Freight costs, transit times |
Some of the most common logistics KPIs include first-attempt delivery rate, order accuracy, and on-time delivery rate. These KPIs show how well you deliver orders, how accurate your shipments are, and if you meet promised delivery times. You also need to watch capacity utilization, which tells you how much of your warehouse or transport resources you use. If you want to see more examples, here is a list of widely accepted KPIs for 2025:
Pick and Pack Costs
Operating Ratio
Net Profit Ratio
Inventory Turnover Ratio
Financial Leverage
Inventory to Sales Ratio
Capacity Utilization
Equipment Utilization Rate
Use of Packing Material
Pick and Pack Cycle Time
Number of Shipments
Truck Turnaround Rate
Driver Performance
Fuel Efficiency
Lead Time (Order Cycle Time)
Why KPIs Matter In 2025
You need KPIs to keep your logistics business healthy. KPIs act like a health check for your supply chain. If a KPI shows a problem, you can fix it before it gets worse.
Think about supply chain KPIs as a 'health check' for your logistics network. Your blood pressure reading itself doesn’t describe your overall health, but if it’s too high or too low, it triggers further investigation and can lead to lifestyle and/or medication changes. Supply chain KPIs work the same way.
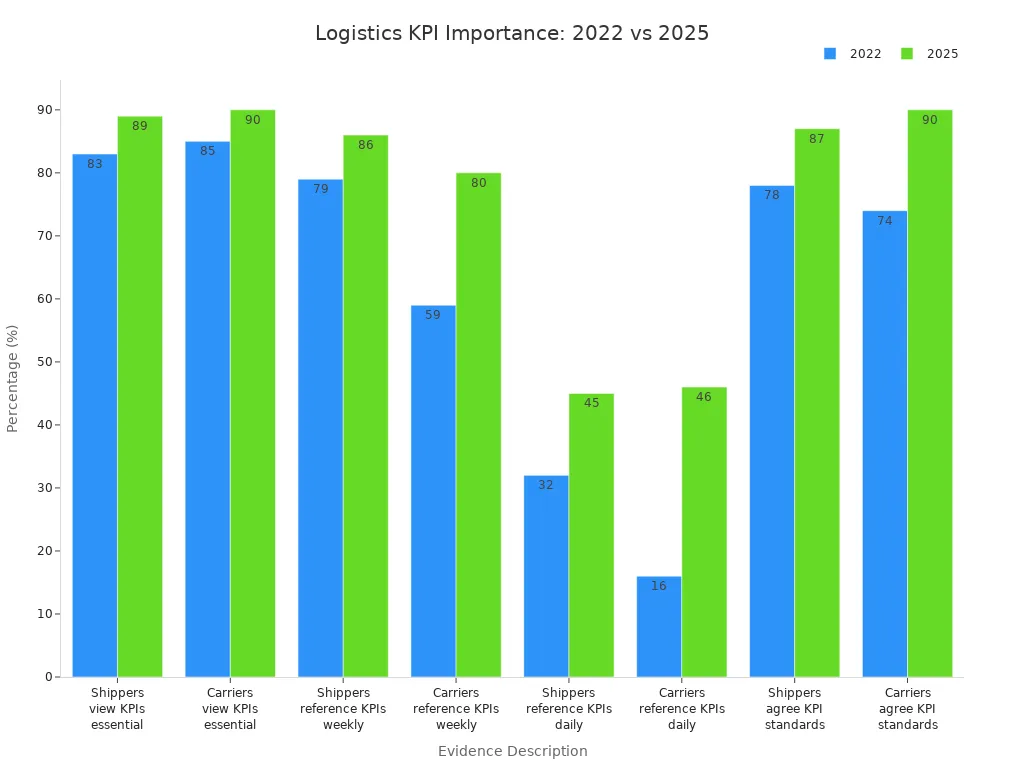
Logistics KPIs help you keep customers happy, control costs, and support sustainability. You can use them to find areas that need improvement and make sure your operations match your business goals. More companies now see KPIs as essential. The table below shows how important KPIs have become from 2022 to 2025:
Evidence Description | 2022 | 2025 |
|---|---|---|
Percentage of shippers who view KPIs as essential | 83% | 89% |
Percentage of carriers who view KPIs as essential | 85% | 90% |
Shippers referencing KPIs at least weekly | 79% | 86% |
Carriers referencing KPIs at least weekly | 59% | 80% |
Shippers referencing KPIs daily | 32% | 45% |
Carriers referencing KPIs daily | 16% | 46% |
Agreement on the need for industry KPI standards (shippers) | 78% | 87% |
Agreement on the need for industry KPI standards (carriers) | 74% | 90% |
You need to choose KPIs that match your business priorities. Logistics industry benchmarks help you compare your performance with others and set goals for improvement.
2025 Logistics Industry Benchmarks

Key Logistics Industry Benchmarks
You need to track the right benchmarks to keep your logistics operations strong in 2025. These benchmarks help you measure how well your supply chain works. They also show you where you can improve. The most important logistics industry benchmarks for 2025 include:
Inventory turnover rate: This shows how many times you sell and replace your inventory in a year. A higher rate means you move products quickly.
Inventory accuracy: This measures how closely your records match your actual stock. High accuracy helps you avoid stockouts and overstock.
Days of inventory on hand (DOH): This tells you how long your inventory will last before you need to restock. Lower days mean you use your stock efficiently.
Freight cost per unit: This shows how much you spend to move each item. Lower costs help you save money.
On-time delivery rate: This measures how often you deliver orders when promised. High rates keep your customers happy.
Order accuracy: This shows how often you ship the right products to your customers. High accuracy means fewer returns and complaints.
Warehouse capacity usage: This tells you how much of your warehouse space you use. Good usage means you do not waste space or money.
Process efficiency: This measures how well your team completes tasks like picking, packing, and shipping. High efficiency means faster service and lower costs.
You can use industry standards like APQC's Open Standards Benchmarking® to compare your performance with other companies. These standards help you set realistic goals and spot areas for improvement.
Benchmark Figures And Their Impact
You need to know the right numbers to set your targets. Here are the benchmark averages for 2025:
Metric | Benchmark Average |
|---|---|
Inventory turnover rate | |
Days sales of inventory (DSI) | 85.5 days |
Inventory accuracy | 95–98%+ |
Order accuracy rate | 97.3% |
These numbers show what top companies achieve. If your inventory turnover rate is 3.2x, you sell and replace your stock more than three times a year. If your inventory accuracy is above 95%, your records match your actual stock almost all the time. An order accuracy rate of 97.3% means you ship the right items in almost every order.
When you track these logistics industry benchmarks, you can see how your business compares to others. If your numbers fall below these averages, you know where to focus your efforts. For example, if your days of inventory on hand are higher than 85.5 days, you may need to move stock faster or reduce overstock. If your freight cost per unit is higher than the industry average, you can look for ways to cut shipping costs.
Tip: Use these benchmarks to set clear goals for your team. Review your numbers often and adjust your processes to stay ahead.
You can use logistics industry benchmarks to guide your decisions. They help you find weak spots, improve your service, and save money. By following industry standards, you make your supply chain more reliable and efficient.
Logistics KPI Categories
Transportation Metrics
You need to track transportation metrics to keep your supply chain moving smoothly. These KPIs help you measure delivery speed, cost, and reliability. Here is a table showing the most important transportation metrics for 2025:
KPI | Description |
|---|---|
On-Time and In-Full (OTIF) | Measures how often shipments arrive on schedule and complete, without missing any items. |
Number of shipments | Tracks the total number of shipments made within a specific period. |
Average delivery time | Calculates the average time taken for deliveries to reach their destination from dispatch. |
Average days late | Assesses the average delay in delivery times against the expected delivery schedule. |
Truck turnaround | Measures the time needed for a truck to complete a delivery cycle. |
Transportation cost | Tracks the expenses involved in the process of transporting goods. |
Freight bill accuracy | Evaluates the precision of freight billing processes. |
You can use these metrics to spot delays, control costs, and improve delivery reliability.
Warehouse KPIs
Warehouse KPIs help you manage inventory and boost efficiency. You need to watch these numbers to keep your warehouse running at its best. Here are the top warehouse KPIs and their benchmark figures for 2025:
KPI | 2025 Benchmark Figures |
|---|---|
Order Accuracy Rate | 99.8% or higher for leading operations |
Inventory Turnover Rate | 12-24 turns annually for fast-moving items |
On-Time Delivery Rate | 98-99% for leading operations |
Warehouse Capacity Utilization | 85-90% optimal utilization |
Labor Productivity | Higher rates through optimization and automation |
Perfect Order Rate | 97-98% for best-in-class warehouses |
Receiving Efficiency | 2-4 hours processing time with 99.9% accuracy |
Energy Efficiency | Substantial reductions through upgrades and renewables |
High order accuracy and fast inventory turnover show that your warehouse meets logistics industry benchmarks.
Delivery And Customer KPIs
You need to measure delivery and customer KPIs to keep customers happy. These metrics show how well you deliver orders and handle customer feedback.
First-attempt delivery rates (FADR)
Package handling accuracy
Customer feedback on driver interactions
KPI | Importance in Customer Satisfaction |
|---|---|
Net Promoter Score (NPS) | Measures customer loyalty and likelihood to recommend. |
First Call Resolution (FCR) | Indicates efficiency in resolving customer issues. |
Customer Effort Score (CES) | Assesses ease of customer interactions. |
Customer Retention Rate (CRR) | Reflects the ability to keep customers over time. |
Companies that monitor these KPIs improve customer satisfaction and build loyalty.
Cost And Financial KPIs
Cost and financial KPIs help you control spending and boost profits. You need to track these numbers to see where you can save money.
KPI | Description | Impact on Profitability |
|---|---|---|
On-Time Delivery (OTD) | Measures percentage of shipments delivered on time. | OTD rates above 95% lead to 10-15% higher customer satisfaction. |
Order Accuracy | Measures percentage of orders delivered without errors. | 98% accuracy can reduce customer complaints by 20% and increase loyalty by 15%. |
Transportation Cost per Unit | Total transportation cost divided by units shipped. | Reducing costs by 5% can increase profit margins by 2-3%. |
Inventory Turnover | Number of times inventory is sold and replaced in a year. | Increasing turnover by 1x can boost profitability by 5%. |
Warehouse Utilization | Percentage of used warehouse space compared to total available space. | Improving utilization by 10% can save 5-10% of total warehouse operating expenses. |
Freight Bill Accuracy | Percentage of accurate freight bills. | Improving accuracy to over 98% can save up to 20% in administrative costs. |
Order Cycle Time | Average time taken to process and deliver an order. | Reducing cycle time from 10 to 5 days can enhance customer loyalty. |
Dock-to-Stock Cycle Time | Time taken to move goods from receiving dock to inventory. | Reducing time by 50% can improve order fulfillment speed by 20%. |
Capacity Utilization | Extent to which logistical resources are used to their full potential. | Improving utilization by 10% can reduce operational costs by 5-10%. |
Return Rate | Percentage of delivered orders returned by customers. | Reducing return rates can lead to significant cost savings and enhanced profitability. |
Labor And Productivity KPIs
Labor and productivity KPIs show how well your team works. You need to track these metrics to improve workforce efficiency.
Logistics professionals lead all industries in productive hours with an average of 7 hrs 3 mins of daily productive time.
The productivity efficiency in logistics is reported at 96%, among the highest across sectors.
KPI | Description |
|---|---|
Order Accuracy Rate | Reduce errors, boost customer satisfaction |
On-Time Delivery (OTD) | Measure delivery performance and reliability |
Inventory Turnover | Optimize stock levels and free up capital |
Warehouse Utilization | Maximize storage and minimize waste |
Cost per Shipment | Track true logistics costs per order |
You can use these KPIs to find ways to train your team, automate tasks, and improve overall productivity.
KPI Data Management

Data Collection
You need strong data collection practices to manage logistics KPIs in 2025. Start by using demand planning and forecasting to predict future needs and optimize inventory. Make sure your data is accurate by using validation and cleansing processes. Protect sensitive information with security and access controls. Integrate data from different sources so you get a complete view of your operations. Master data management helps you keep core business data consistent across all platforms. Use advanced analytics tools to find patterns and trends in your data. Continuous improvement through data stewardship keeps your data quality high and makes it more useful over time.
Tip: Regular audits and real-time validation help you catch errors quickly and keep your data reliable.
Benchmarking Practices
Benchmarking lets you compare your performance with industry standards and best practices. You should use digital tools to monitor KPIs and spot inefficiencies. Companies like Amazon and DHL use advanced analytics to automate insights and reduce delays. Predictive ETA and smart warehouse slotting help solve logistics challenges. Visibility platforms combine data from many sources, giving you a unified view for better decisions. Regular audits and ongoing employee training keep your data management skills sharp. When you benchmark, you can identify overspending on freight rates, highlight routing inefficiencies, and set goals based on delivery times and order accuracy.
Benchmarking Step | Benefit |
|---|---|
Compare KPIs to industry | Spot gaps and control costs |
Use digital tools | Automate insights |
Audit data regularly | Maintain data integrity |
Train employees | Improve data management |
Actionable Insights
Analyzing KPI data gives you the power to optimize operations and improve customer satisfaction. Real-time access to KPIs helps you boost supply chain efficiency. Tracking essential KPIs lets you make smart decisions and stay competitive. You can use data insights to identify bottlenecks, reduce costs, and personalize delivery for customers. Companies that use data-driven management practices see better tracking, faster problem-solving, and improved customer experiences.
You can drive continuous improvement by acting on the insights from your KPI data. Set clear goals, monitor progress, and adjust your strategies to keep your logistics operations ahead of the curve.
You need to track logistics industry benchmarks and KPIs to keep your business strong in 2025. These metrics help you spot problems, save money, and stay ahead of your competitors. When you use data-driven strategies, you make better decisions every day.
Measure your progress with clear KPIs.
Compare your results to industry standards.
Adjust your plans to improve performance.
Stay focused on your data. You will build a more efficient and successful logistics operation.
FAQ
What is the most important logistics KPI for 2025?
You should focus on inventory turnover rate. This KPI shows how quickly you sell and replace products. High turnover means you manage stock well and avoid waste.
How often should you review logistics KPIs?
You need to check your KPIs at least once a week. Many top companies review them daily. Regular reviews help you spot problems early and keep your operations running smoothly.
Why does warehouse capacity usage matter?
You use warehouse capacity usage to see if you fill your space efficiently.
High usage means you save money and avoid wasted space.
Low usage can show you need to reorganize or reduce inventory.
How can you improve on-time delivery rates?
You can train your team, use route planning software, and monitor delivery times. Fast and accurate deliveries keep your customers happy and help you meet industry benchmarks.
See Also
Key Strategies for Effective Management of Global Logistics
The Role of Direct Logistics Systems in Global Efficiency
Enhancing International Operations Through Innovative Logistics Solutions
Prepare for Holiday Demand with PGL’s Logistics Services
PGL Transforms West Coast Trucking for Today’s Supply Chains